Full manuscript · Chapter 4 of 6
Optical Architectural Typology (L-OAT)
Associated research DOI: https://doi.org/10.5281/zenodo.23066772. Exact manuscript–record relationship awaits verification.
Lumineyes Optical Architectural Typology (L-OAT): a critical review and multimodal framework for quantitative iris phenotyping
Mustafa Mete, MD
MyLumineyes Research, Istanbul, Türkiye
Corresponding author: Mustafa Mete, MD — info@mylumineyes.com
ORCID: 0009-0004-3128-2853
Abstract
Purpose: To examine the technical limits of current quantitative iris phenotyping and specify a testable cross-modal measurement framework integrating visible color, iris geometry and optical coherence tomography (OCT) signal attributes.
Methods: This critical narrative synthesis examines published approaches to calibrated photographic colorimetry, anterior-segment OCT morphometry and OCT attenuation analysis. On this basis, Lumineyes Optical Architectural Typology (L-OAT) is operationalized as three separate baseline domains: appearance (P), architecture (A) and OCT signal (O). A provisional 16-region photographic scheme, feature provenance, registration constraints and staged validation criteria are described.
Results: Published approaches provide quantitative color, morphometric and polarization-sensitive measurements but differ in sampling geometry, biological specificity and device dependence. L-OAT specifies auditable appearance (P), architecture (A) and OCT signal (O) domains, a provisional 16-region photographic grid, quality gates and explicit failure criteria. Because pupil deformation, multiple scattering and low-lightness colorimetry can introduce errors, anatomical correspondence and OCT optical parameters are conditional on independent validation. The intended test is whether reliable A/O features improve held-out information beyond baseline photographic color. No human L-OAT validation, clinical classification accuracy or predictive gain is claimed.
Conclusion: L-OAT is a falsifiable, unvalidated cross-modal measurement proposal, not an iris-melanin assay or an established clinical classification. Its usefulness depends on repeatability, defensible registration and demonstrable incremental information in independent data.
Keywords: iris color; anterior-segment optical coherence tomography; colorimetry; multimodal imaging; quantitative phenotyping; stromal architecture
Introduction
Descriptions such as brown, hazel, green, grey and blue remain useful clinically, yet they combine visible color, its spatial distribution and the conditions of observation into a single category. Calibrated photography permits continuous and sector-based measures that preserve variation lost in categorical labels. [1, 2] The appearance of an iris also depends on the interaction of melanin absorption, stromal architecture and wavelength-dependent scattering; no single color coordinate characterizes these optical and anatomical components. [3]
Anterior-segment OCT (AS-OCT) extends assessment beyond visible photography, but OCT intensity depends on acquisition wavelength, focus, instrument sensitivity and image processing. [4] Existing research has quantified iris pigmentation across populations,[5] measured three-dimensional iris geometry,[6] and related polarization-sensitive AS-OCT measurements to iris color in brown eyes. [7] These approaches establish important components of quantitative phenotyping. The unresolved problem is how to combine heterogeneous measurements into a common, auditable iris phenotype while preserving differences in sampling, biological specificity and instrument reliability.
Existing studies have already quantified photographic iris color and regional heterogeneity, examined iris morphology with three-dimensional swept-source AS-OCT, and investigated melanin-related polarization-sensitive AS-OCT contrast in pigmented irides [1, 5–7]. The contribution proposed here is therefore not a new imaging modality or an established melanin measurement. Instead, L-OAT specifies how to preserve the anatomical location, calibration context, uncertainty, and missingness of each cross-modal feature and how to test the value added beyond simpler color assessment. No diagnostic or prognostic usefulness is assumed.
L-OAT addresses this unresolved cross-modal problem with a candidate feature specification and an empirical validation pathway (Fig. 1). Its intended output is a baseline phenotype record that can be compared across repeated acquisitions and, in later studies, related to subsequent observable change. The framework is not tied to any particular intervention: pigment-modifying procedures represent one prospective application, not its defining measurement principle.
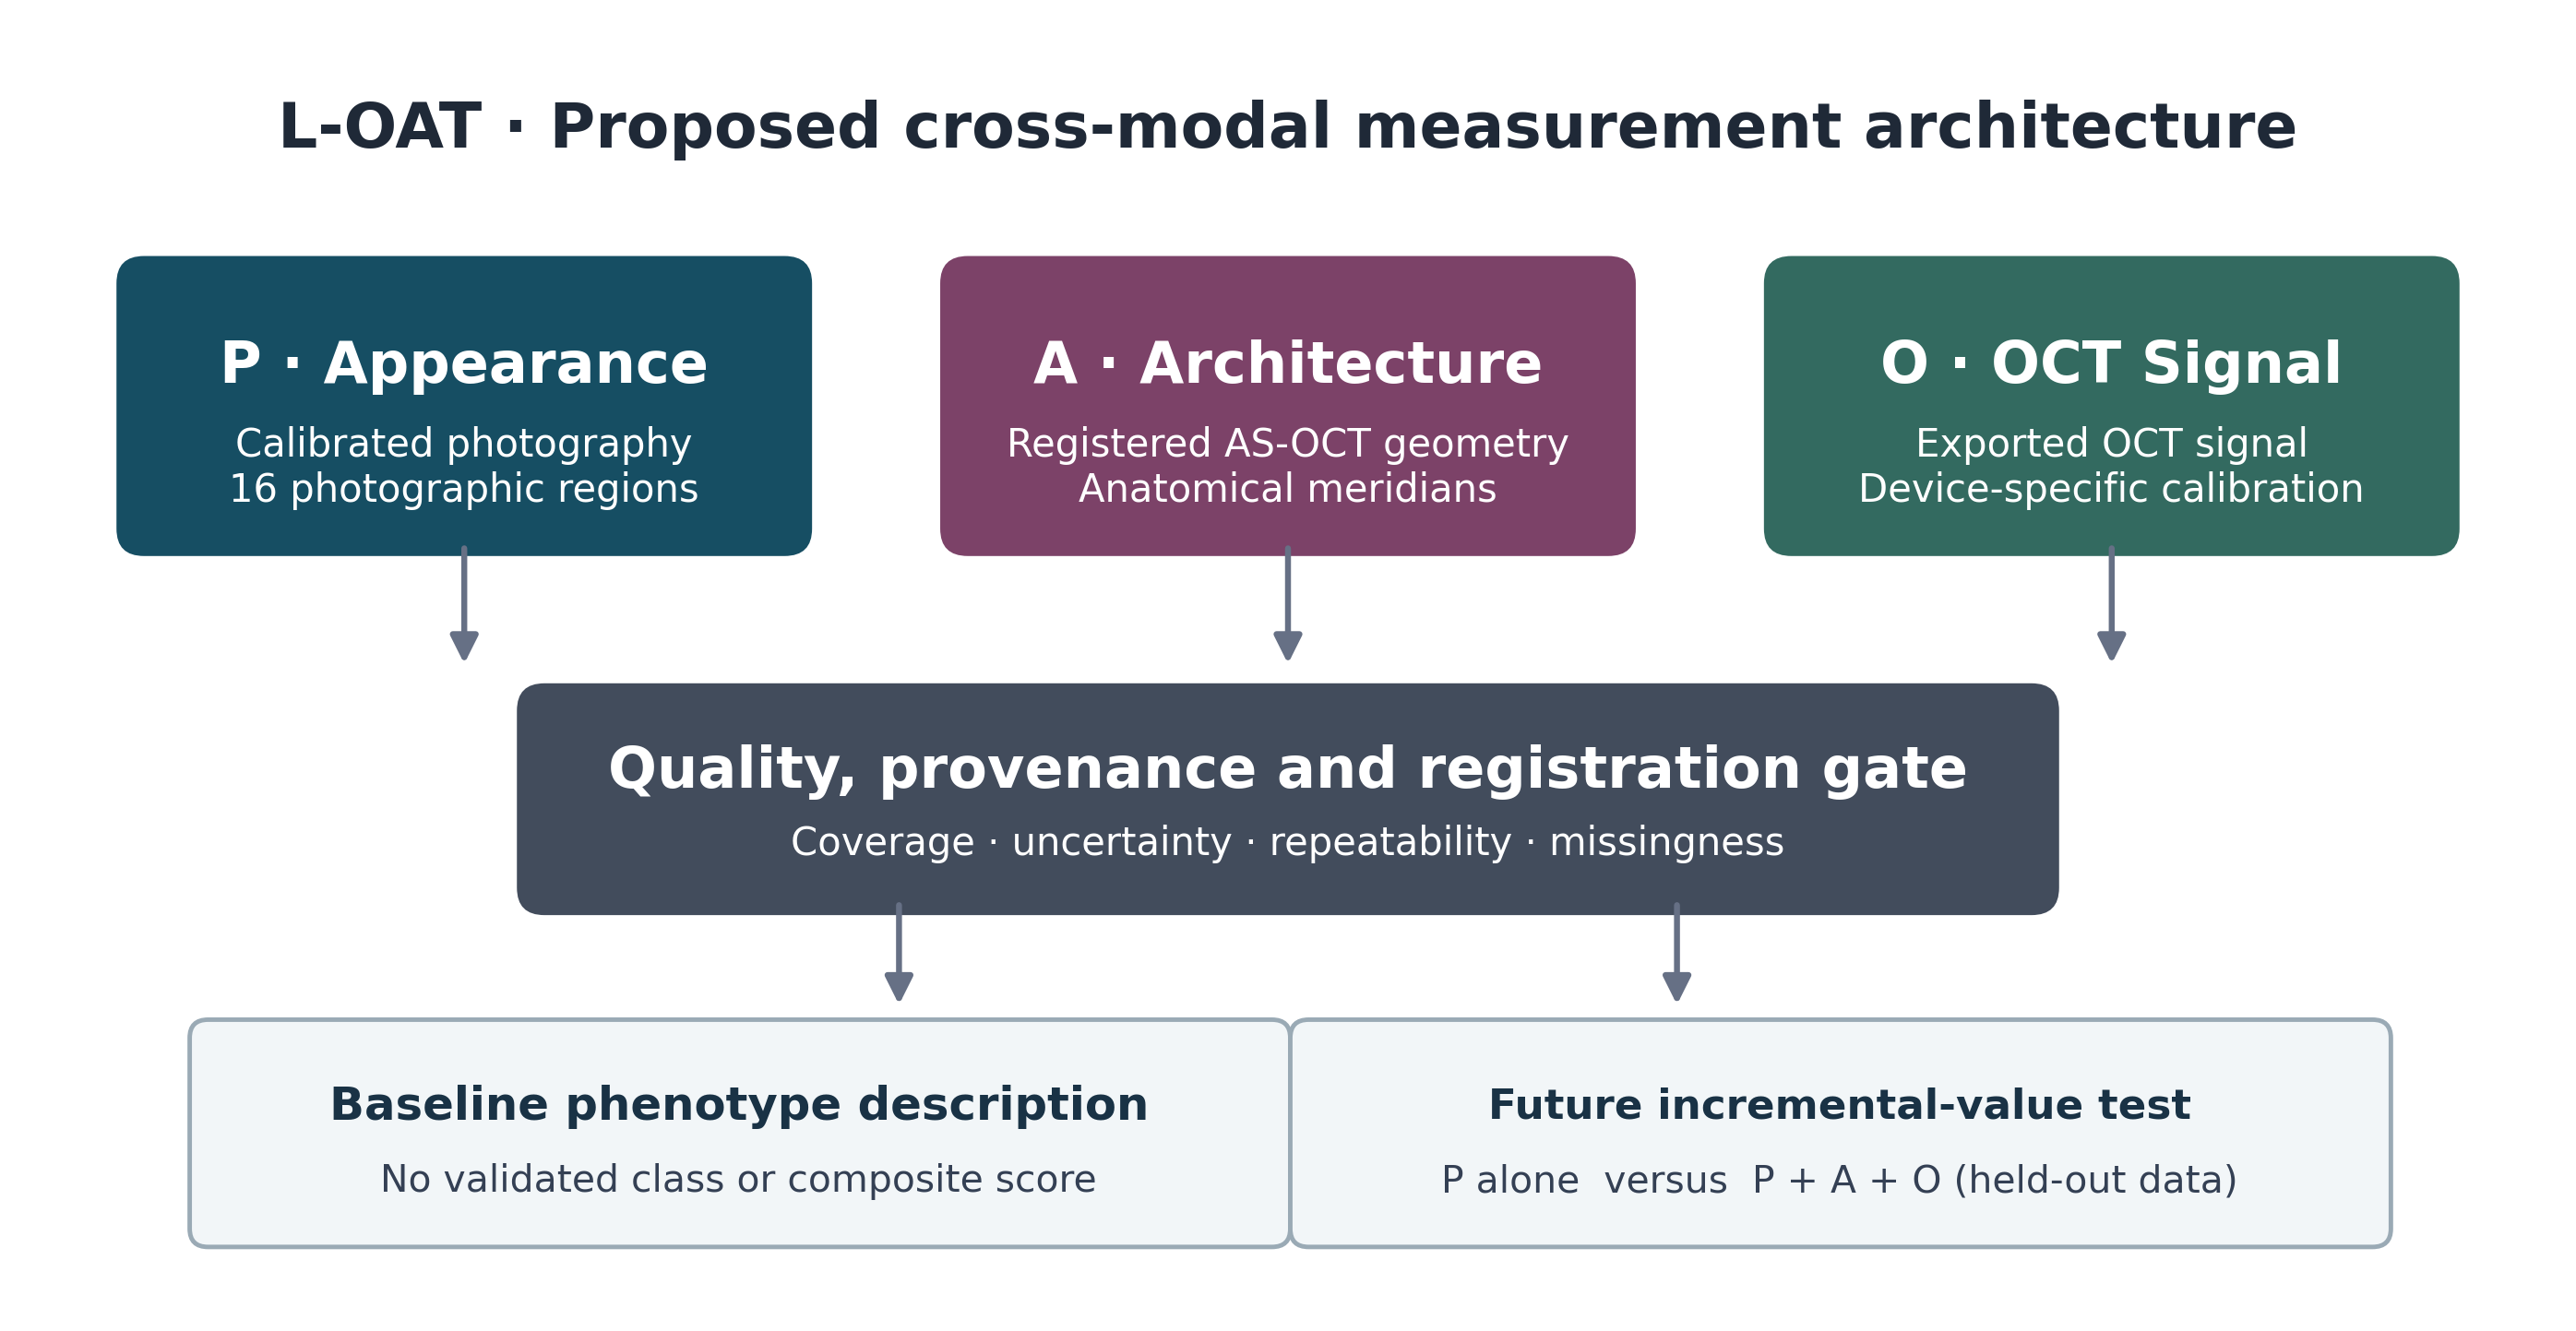
Fig. 1 Proposed L-OAT measurement architecture. Independent P, A and O features enter a provenance and quality-control gate. The 16-region grid applies to calibrated photographs; OCT meridians are assigned only when anatomically acquired and registered. Baseline descriptive use is separated from future longitudinal incremental-value testing
Review scope and novelty boundary. This article critically synthesizes measurement families already established in the literature, then proposes an explicit cross-modal test architecture. Neither the integrated feature dictionary nor the 16-sector choice has been clinically validated; the manuscript does not assign sensitivity, specificity, prediction accuracy, treatment efficacy or treatment safety to L-OAT. The proposed novelty must be judged by whether the integration is reproducible and adds externally demonstrated information beyond conventional colorimetry.
Critical literature synthesis and measurement methods
Conceptual synthesis and measurement domains
This critical narrative review draws together published methods in calibrated photographic iris colorimetry, image-derived iris morphometry, polarization-sensitive imaging, and OCT intensity and attenuation analysis [1–10]. The sources were evaluated qualitatively for candidate measurements, modality-specific assumptions, acquisition and registration dependencies, repeatability requirements, and limits of biological interpretation. The review was not designed as a systematic evidence search and does not report pooled estimates. Its synthesis informs a proposed, prospectively testable L-OAT measurement specification.
Use of AI assistance. OpenAI ChatGPT (GPT-6) assisted with English-language drafting and editing, manuscript organization, literature cross-checking, and Python-scripted preparation of conceptual illustrations, including the synthetic OCT depth–intensity schematic in Fig. 2. The schematic does not represent patient measurements or analysis of empirical OCT data. The author reviewed and approved the scientific content and final manuscript.
The baseline representation is defined as L-OAT(T₀) = [P(T₀), A(T₀), O(T₀)] (1). P, A and O are domain-specific feature groups rather than a numerical score. No biological weights, grade boundaries or optimal combination rule are specified in advance; their estimation would require independent measurements and validation.
Evidence boundary. The published research establishes the existence and limitations of individual measurement families; the integrated L-OAT dictionary, 16-region photographic grid and validation gates are new proposals. This article does not report a clinical cohort, a systematic review, an imaging instrument validation study or fitted human-iris predictive models. Equations are illustrative candidate operations. The ethical and data-governance requirements of any subsequent study would be addressed according to the data actually collected.
Visible appearance: photographic colorimetry (P)
Visible-light acquisition should use a fixed camera/lens configuration, documented illumination geometry and spectrum, exposure, white balance, color reference target and image-processing workflow. Raw image retention is preferred where feasible. The pipeline should exclude the pupil, sclera, eyelids, eyelashes, saturated highlights, corneal reflections and ungradable regions. Intra-eye repeatability should be measured before small observed color differences are interpreted as longitudinal change.
Photographic quality control should record whether the color reference is illuminated under conditions representative of the iris, the spectral characteristics of the source, calibration residuals, camera profile and raw-to-CIELAB conversion settings. A color target positioned outside the acquisition plane cannot automatically remove geometry-dependent reflections. Predefine exclusion rules for image clipping, corneal glare, inadequate focus and exposure mismatch. Two independent graders, or an audited segmentation model and a grader, should test pupil–limbus boundaries and specular-reflection masks on a subset. Earlier colorimetric work demonstrated why image geometry and iris texture need not be captured adequately by a single apparent color metric. [11, 12]
Under a specified white reference and color-managed conversion, derive CIE L*, a* and b* coordinates and robust global summaries [13]. A provisional sampling grid partitions the photographic iris into eight angular sectors and two radial bands (16 photographic regions); it is an operational sampling choice to be tested for repeatability, not a claim that an OCT B-scan samples each photographic sector. Report coverage and missingness. Texture descriptors may be considered only after their stability under illumination and pupil variation is demonstrated. CIEDE2000 ΔE₀₀ summarizes color difference between calibrated time points but must be interpreted with the directional ΔL*, Δa* and Δb* and an empirically estimated test–retest error [14]. Published color-difference experiments on dark textile samples report limitations at low lightness and chroma [15], a caution rather than an established iris-specific error magnitude. Therefore prespecify low-L* and low-chroma sensitivity analyses, calibration residuals and uncertainty intervals instead of treating small ΔE₀₀ changes in dark irides as self-evidently reliable.
Regional sampling geometry. After delineating the pupillary and outer iris borders in each image independently, define u = (r − r_pupil(θ))/(r_limbus(θ) − r_pupil(θ)) as a *photographic sampling coordinate* for valid angles θ. Two radial bands (0 ≤ u < 0.5 and 0.5 ≤ u ≤ 1) crossed with eight 45° sectors define 16 image regions. Eye laterality, reference meridian, image rotation and landmark choice must be recorded; left/right views must not be mirrored without documentation. This mapping describes proportional image position only: a pixel assigned to the same u and θ at two visits must NOT be assumed to represent the same stromal tissue. Sector-specific area, glare masks and exclusions are reported at each time point. Region-level longitudinal correspondence requires independent landmark tracking or validated deformable registration and a documented spatial-error threshold; otherwise use a global/eye-level summary. Compare 16 sectors against coarser or finer *preselected* grids for reproducibility rather than optimizing region count on outcomes.
Iris architecture: image-derived geometry (A)
AS-OCT candidate features include iris thickness at defined anatomical landmarks, curvature or cross-sectional area where segmentation permits, and within-eye geometric heterogeneity. Volumetric metrics require a genuinely three-dimensional acquisition and validated segmentation; a two-dimensional B-scan cannot supply iris volume. Each feature should retain its source meridian or volume identifier, spatial location, units and segmentation quality.
Record pupil diameter and illumination state, accommodation-related acquisition conditions when relevant, and pharmacological dilation. Because iris geometry varies with pupil state [16], repeated scans should use matched conditions whenever feasible. In-vivo digital image-correlation and finite-element work has measured substantial iris strains during the pupillary light reflex, including approximately spatially uniform radial strain over much of the imaged iris in a selected dataset [17]. That finding neither establishes a universally linear tissue transformation nor validates simple radial normalization as material-point tracking. For longitudinal comparisons, record pupil-state differences, assess repeatability of landmarks and—only if justified by validation data—use nonrigid or deformable image registration. Photographic sectors and OCT meridians should be linked only when spatial overlap and registration error can be documented; uncertain sector matching remains missing rather than imputed.
Registration uncertainty should be quantified, not hidden. A photographic wedge integrates a two-dimensional surface region, whereas an OCT B-scan samples a depth-resolved meridian. Matching requires known meridian orientation, pupil and limbal boundaries, reproducible landmarks, compatible acquisition timing and an explicit overlap or registration-error estimate. When conditions fail, only eye-level multimodal associations—not fictitious 16-sector OCT correspondence—are permissible. A prespecified sensitivity analysis should compare (i) high-confidence landmark-registered matches, (ii) eye-level summaries and (iii) all technically gradable images. A validation subset should be independently relabeled across dilation states and compared with deformable registration; no technique is presumed adequate in advance. Record prior anterior-segment surgery, iris atrophy and inflammation as potentially relevant anatomical modifiers.
OCT signal: acquisition and attenuation models (O)
The first analytical tier comprises signal attributes that can be exported and reproduced reliably, such as stromal-region intensity summaries, depth distribution and sectoral dispersion. The exported data type must be established: linear intensity, amplitude and display-processed grayscale values are not interchangeable. Instrument wavelength, gain, focus, averaging, sensitivity roll-off, processing and noise-floor information accompany each acquisition. Speckle reduction, if applied, must follow a fixed, documented pipeline and be evaluated for bias in quantitative features.
Where the same acquisition contains a defensible reference region and both regions remain above background, an exploratory background-adjusted signal ratio is:
R = (S_iris − S_background) / (S_reference − S_background) (2)
The comparator is selected through a reproducibility pilot. A corneal or scleral reference cannot be treated as invariant simply because it appears in the same image: depth, angle, focus, tissue state and instrument processing may change the ratio. If reference suitability is not demonstrated, the feature is excluded rather than assigned an unverified normalization.
For each instrument, measure whether candidate reference and iris signals vary together when gain, scan depth, focus or illumination conditions are perturbed in controlled repeats. A stable-looking reference must not be assumed to be physically invariant. Prespecified failure of the ratio to improve repeatability over raw documented signal features is a reason to reject that normalization. All candidate ratios should carry their denominator values and excluded-denominator counts.
A simplified conditional OCT forward model is included solely to expose potential confounding between depth-dependent signal decay and instrument response [4, 8]. Figure 2 shows a synthetic signal-window illustration, not an iris-derived attenuation measurement. This expression is neither a universal solution to radiative transfer in the iris nor evidence that a physical tissue attenuation coefficient can be uniquely recovered.
I_meas(z) = B(z) + K · h(z; z_f) · T(z) · exp(−2μ_app z) (3)
In Equation (3), B(z) represents background; h(z; z_f), the confocal response; T(z), sensitivity roll-off; K, a local backscatter/instrument factor; and μ_app, a *phenomenological apparent* depth-decay parameter over a declared fitting window. The exponential assumes that a local effective description is informative; layered stromal backscatter, variable refractive path, posterior pigment epithelium, finite imaging depth, signal clipping and background subtraction can confound K and μ_app. In multiply scattering tissue, a fitted μ_app need not equal the local absorption coefficient, single-scattering attenuation, total scattering coefficient or pigment content. Identifiability and estimator bias must be established by simulation/phantom calibration and controlled within-eye reacquisition before between-iris comparison [4, 8–10]. The Figure 2 trace is synthetic, with illustrative noise, and yields no measured biological parameter.
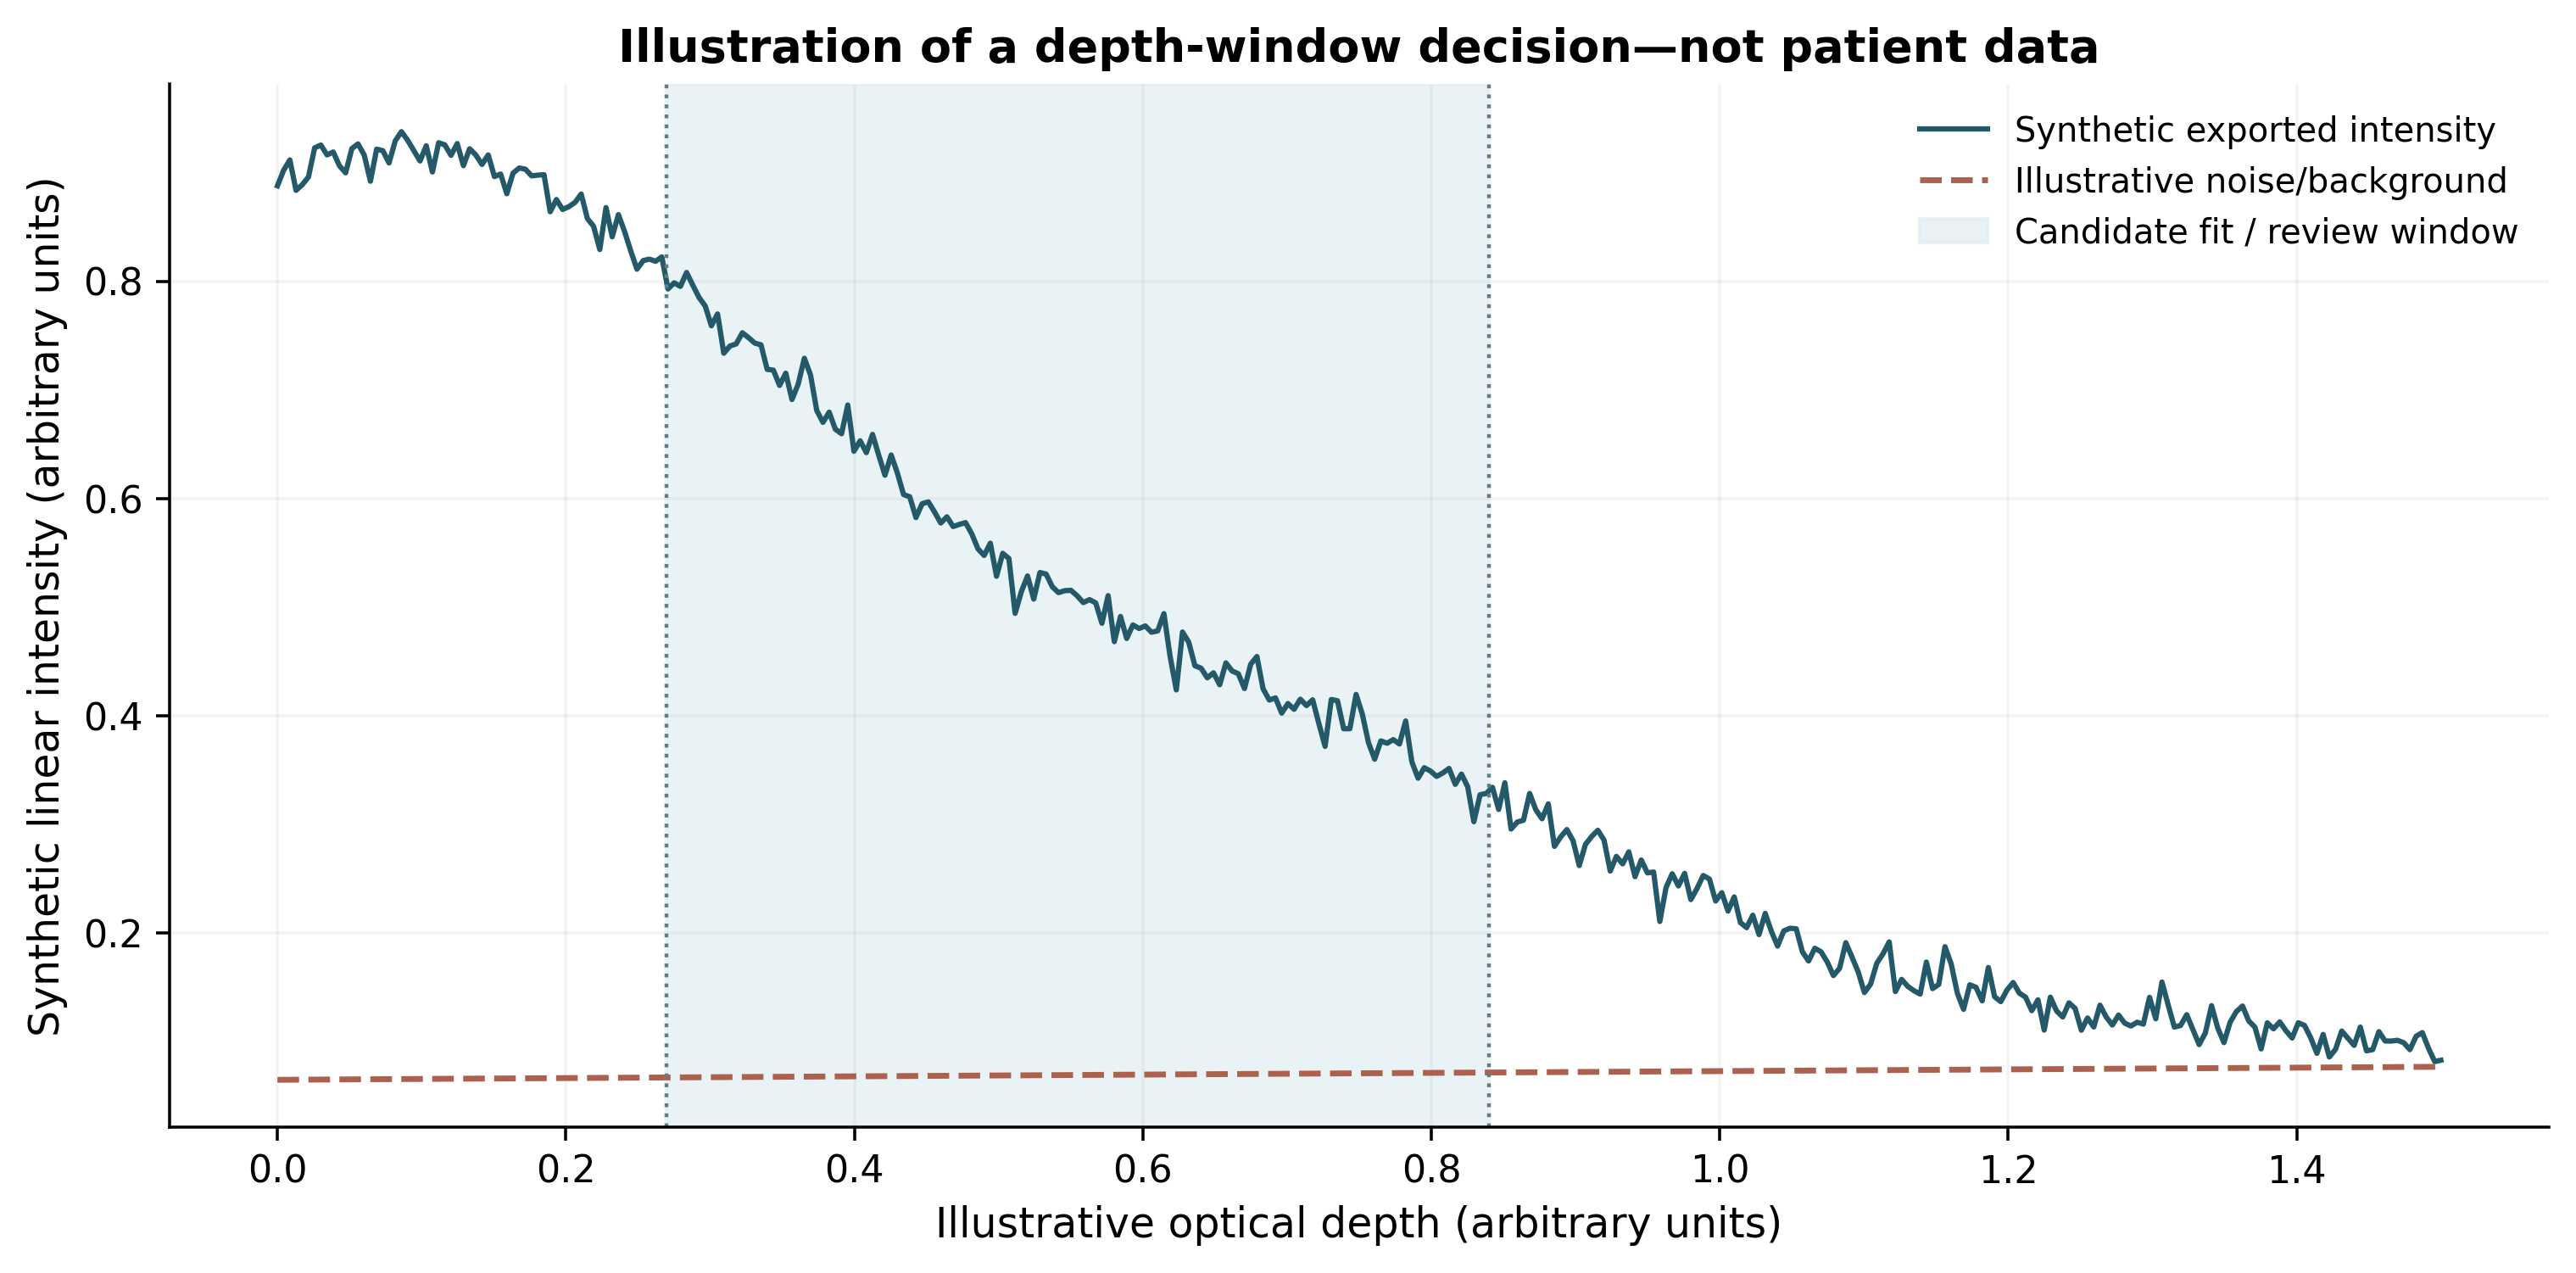
Fig. 2 Synthetic OCT depth–intensity example. The shaded interval depicts a candidate quality-controlled analysis window; the intensity curve and background are schematic. No patient measurement, clinical threshold or measured attenuation coefficient is shown
Equation (3) applies, at most, to a documented *linear-intensity* export and a declared optical-depth convention; it must not be fitted unchanged to log-compressed display images. Multiple and dependent scattering, heterogeneous backscatter, focus changes and coherent speckle may change the observed depth profile, sometimes producing plausible but nonunique apparent coefficients [4]. The reported analysis must disclose depth window, fit diagnostics, residual patterns, unusable-signal frequency, gain and noise-floor dependence. Without demonstrated robustness to these assumptions, the O domain should retain reproducible signal/texture descriptions and omit μ_app, rather than assign a tissue-specific or device-invariant interpretation.
Depth-resolved integral approaches can retain axial information and may outperform simple single-exponential fits under some measurement conditions [9]. They still require assumptions concerning residual signal, finite depth, backscattering fraction and layer delineation; layer-specific extensions treat some of these issues [10]. Conventional OCT intensity cannot independently resolve melanin absorption from collagen, vessels, and other scattering contributions. Polarization-sensitive OCT (PS-OCT) measures a distinct polarimetric contrast: depolarization descriptors such as DOPU or polarimetric entropy are not interchangeable with an intensity attenuation fit, nor is either an unqualified universal melanin gold standard [7, 18]. The L-OAT technical pilot should compare first-tier signal summaries and any attenuation estimator on the same device, against calibration, repeatability, finite-depth bias and usable iris-layer coverage; unreliable O features are excluded rather than cosmetically normalized.
Proposed L-OAT framework and testable hypotheses
The conceptual output is a three-domain L-OAT baseline feature specification and a staged testing strategy; this section describes proposed measurements and analytical questions rather than patient-level outcomes.
A proposed result should be reported at two levels: (i) a descriptive feature set that survives the technical quality gate and (ii) distinct hypotheses concerning biological relevance and incremental value. Technical feasibility alone would not establish clinical validity. Likewise, significant cross-sectional color–OCT correlations would not establish causation or clinical outcome prediction.
Proposed baseline construct and hypotheses
The L-OAT architecture in Fig. 1 distinguishes three candidate baseline domains: P, calibrated visible appearance and spatial color distribution; A, iris geometry and architecture from anatomically documented imaging; and O, OCT signal characteristics with explicit export type and quality controls. An integrated record is assembled only after a cross-modal provenance and registration gate. The three domains remain separate until data demonstrate a reproducible reason to combine them.
The baseline feature groups are defined in Equation (1); retaining them separately avoids introducing an unvalidated composite score.
The primary hypothesis is that a reproducible multimodal representation characterizes iris variation more completely than a categorical color label. The prospective longitudinal hypothesis is more discriminating: prespecified reliable A and O features may explain additional variation in measured color change after accounting for baseline P features, exposure and relevant clinical covariates. A null result—no incremental information beyond baseline color—would directly test the proposed utility. Figure 1 depicts the baseline measurement pathway and the two distinct analytical applications.
Three falsifiable comparisons are central. First, does region-resolved P provide information beyond a single categorical color or global CIELAB summary when evaluated under held-out acquisitions? Second, do technically stable A and O features characterize reproducible variability not reducible to pupil state, image quality or the P domain? Third, for a prespecified longitudinal endpoint, does adding A/O to the P-only comparator improve participant-level out-of-sample performance by an amount exceeding the repeatability error of that endpoint? Results that do not satisfy these tests would limit L-OAT to a descriptive acquisition taxonomy. The primary question is incremental information, not an a priori claim of superiority.
Candidate features and quality controls
Table 1 specifies the initial cross-modal feature dictionary. Each feature should have a source image, anatomical location, physical units (where applicable), processing version, quality rule and explicit missing-data code before downstream analysis. The proposed phased validation and prespecified failure signals are summarized in Table 2.
Minimum provenance metadata include participant and eye identifier (pseudonymized for analysis), eye laterality, visit/date, image modality, device and software version, illumination and pupil diameter, acquisition/registration coordinates, grader or segmentation version, feature units, quality flags and processing code version. Record the reason for every missing sector or excluded depth interval. Quality exclusions may be phenotype-dependent—for example, more heavily pigmented tissue may have inadequate posterior OCT signal—so complete-case analysis must be accompanied by a missingness map stratified by baseline appearance rather than described as representative without assessment.
Staged evaluation strategy
Phase 1: technical feasibility and repeatability
A technical pilot should establish raw-data export feasibility, segmented-region visibility across pigmentation grades, calibration stability, repeated-acquisition variation, intergrader agreement, cross-modal registration error and sector-level missingness. Absolute within-eye error and agreement limits should accompany intraclass correlation statistics so that reliability is not inferred from correlation alone. For measurements from different OCT platforms, device-specific repeatability and proportional bias must be assessed before pooling; a universal conversion factor should not be assumed. Processing variants, including speckle suppression and attenuation estimators, should be selected on their measured effect on repeatability and bias, not on visual smoothness. Table 2 summarizes predeclared validation gates and corresponding failure decisions.
Predeclared Phase 1 outputs should include the per-domain and per-sector acquisition success rate; absolute within-eye test–retest error and coefficient of repeatability where suitable; limits of agreement; selected single- or average-measure intraclass correlation coefficient (ICC) with its model, definition and confidence interval; intergrader variation; calibration drift; and registration error in the image coordinate system. [19, 20] Report results across the available pigment range and pupil diameters rather than only an overall ICC, which may appear high when between-eye variation is large. Define acceptable measurement error prospectively according to the intended endpoint and feasibility pilot, not by selecting a threshold after viewing favorable results. Sample size for repeatability and agreement should be planned using the desired confidence interval or smallest relevant detectable difference.
Phase 2: construct assessment and phenotype structure
After excluding unstable, redundant or poorly covered variables, investigate continuous latent dimensions of the baseline phenotype using scaling parameters estimated from training data. Exploratory principal-components or cluster analyses may be used, but the number and stability of any groups should be tested in resampling and external replication. Continuous axes should be retained when clusters are unstable. An independent clinical pigmentation grade, such as LIPS, can serve as an external descriptor rather than a component silently built into the OCT signal features.
Cross-modal association is not construct validation by itself. Examine whether spatial photographic heterogeneity correlates with structural heterogeneity after controlling for pupil diameter, device settings and image quality, and whether the pattern is reproducible under reacquisition. Feature reduction should use only the training set; sector count, preprocessing, candidate feature inclusion and number of components must be frozen before evaluating an independent set. Test stability across pigment categories, eye laterality, age-related variation and available acquisition devices, and describe groups as exploratory unless independently replicated. If continuous dimensions outperform unstable clusters, report continuous descriptors rather than forcing an ordinal typology.
Phase 3: longitudinal incremental-value testing
In a prospective repeated-measures study, collect matched baseline and follow-up photography with AS-OCT at prespecified visits and record pupil state, acquisition settings, medication, any intervention and cumulative exposure. For a comparable region or iris summary, ΔL* = L*(t₁) − L*(t₀), with analogous Δa* and Δb*, describes direction. CIEDE2000 ΔE₀₀ summarizes color difference magnitude and is interpreted alongside those directional components. [14] The primary analysis should compare a baseline-color model with a model that additionally includes technically reliable A/O features, examining out-of-sample performance and uncertainty. Split training and evaluation by participant, account for correlation between fellow eyes and include exposure and clinical covariates. The sample size is to be specified from pilot variability for the chosen primary endpoint. This design tests incremental information rather than presuming treatment-response prediction.
A concrete model-comparison protocol would specify one primary endpoint in advance (for example, participant-level change in globally registered L* or ΔE₀₀), a clinically relevant assessment interval, and a P-only baseline model. Compare it with a nested P+A+O model using participant-disjoint validation and the same eligibility criteria. Report performance difference with uncertainty, calibration where predictions are made, subgroup and missingness analyses, and the relation of any apparent gain to measured image repeatability. Repeated sectors, sessions and fellow eyes are correlated observations, not independent sample-size multipliers. No numerical improvement, effect size or power is asserted here. If a predictive model is eventually developed, report it using appropriate prediction-model guidance such as TRIPOD+AI. [21]
Discussion
L-OAT organizes three established measurement families into a cross-modal specification that preserves the provenance, coordinate-system assumptions, quality thresholds, uncertainties, and missingness of each candidate feature. The conceptual contribution is a *proposed common measurement protocol and falsification pathway*, not the discovery of a new optical contrast, a validated iris class, or demonstration of superior clinical performance. Table 3 contrasts each existing technique with the added operational requirements and empirical evidence needed for an incremental-value claim.
The proposed contribution is measurement discipline: appearance is separated from tissue geometry and OCT contrast; uncertain spatial matches remain missing; analytic choices are frozen before independent evaluation; and comparisons must be made against a simpler P-only baseline. Combining existing components is not automatically useful. If external studies show no gain over calibrated color photography, the appropriate result is a negative incremental-value finding and a restricted descriptive role—not a new biological classification. The term “typology” names the working program and does not assert the presence of discovered discrete iris subtypes.
A critical distinction is between tissue structure, measured OCT signal and visible color. OCT attenuation depends on its illumination and detection wavelength as well as optical and instrument factors; photographic color is acquired at visible wavelengths under different conditions. Their association is therefore an empirical question. Likewise, reference-normalized signal, conventional intensity OCT and melanin-related polarization-sensitive metrics must be assessed as distinct features rather than conflated as a single pigmentation measure.
Li and colleagues investigated polarization-sensitive anterior-segment OCT (PS-AS-OCT) in 88 brown-irided participants and reported associations between an *entropy-derived melanin concentration ratio* and photographed CIELAB coordinates [7]. Their study provides empirical evidence for melanin-related polarimetric contrast, but did not establish that conventional intensity OCT quantifies stromal melanin across all iris colors. Independent work has evaluated polarization entropy and other depolarization metrics, including their dependence on incident polarization and noise corrections [18]. L-OAT therefore treats optional PS-OCT features as an advanced, separately calibrated O-domain subset, not as a requirement for basic architecture and appearance assessment or a substitute for histological ground truth. The proposed cross-modal framework must show reproducible spatial correspondence and value beyond baseline color and device effects, rather than claim novelty for the underlying imaging technology.
Potential research applications include comparative iris phenotyping and longitudinal studies of structural and appearance change. For studies involving pigment-modifying procedures, treatment architecture, dose exposure, medication and follow-up context should be recorded to avoid attributing differences in outcome solely to baseline iris features. The proposed measurements complement clinical assessment and do not replace procedure-specific safety staging.
Relationship to longitudinal response frameworks. L-OAT defines candidate baseline phenotype measurements. In a later study it could supply baseline explanatory variables for serial response analyses, but it is not itself a treatment protocol, a safety score, a validated prediction instrument or a substitute for independent ocular outcome measures. Any study linking L-OAT to an intervention should predefine treatment and medication exposure, separate optical appearance change from structural and physiological outcomes, and avoid circular validation in which the same post-treatment images define both predictors and outcomes.
Colorimetric sensitivity in dark irides. Standardized CIEDE2000 is retained to enable comparable color-difference reporting [14], but it is not a stand-alone measure of microscopic stromal pigment change. Low-lightness and low-chroma samples can challenge perceptual color-difference agreement in non-ocular datasets [15]. Dark-iris photographic evaluation should therefore report calibration residuals, repeated-acquisition error, underexposed-pixel exclusions, changes in each L*a*b* coordinate and prespecified uncertainty bounds; an iris-specific perceptual or analytical correction cannot be asserted without an iris validation study.
Technical limitations and next experiments
The immediate experiments are a feasibility and test–retest study covering diverse pigmentation and pupil states, a registration validation with independently tracked landmarks, and a device-specific OCT signal calibration that includes dark-image dropout and multiple-scattering sensitivity. If the 16-region grid is not reproducible, a coarser grid or global analysis should replace it. If attenuation estimates fail calibration or identifiability criteria, only signal descriptors remain eligible. An independent cohort should then test whether P+A+O provides information beyond P-only. The present report contains no participant-level measurement, clinical effectiveness estimate or demonstrated predictive endpoint.
Failure conditions and reproducibility. The proposal would be weakened if sector boundaries prove unstable across normal dilation, if cross-modal registration cannot reach reliable agreement, if OCT-derived features remain dominated by instrument or pigmentation-related signal dropout, if prospective color changes are smaller than test–retest variability, or if multimodal features fail to improve held-out results beyond simpler photography. A useful publication of the feasibility pilot should include negative and inconclusive findings, the anonymized feature specification, segmentation rules, processing-version history and device-specific quality criteria. Such transparency is a stronger test of L-OAT than internally consistent conceptual illustrations.
Conclusions
L-OAT proposes a testable framework for describing iris appearance (P), image-derived architecture (A) and OCT signal (O) without treating them as equivalent melanin measurements. Its provisional 16-region grid describes photographic sampling, not fixed tissue tracking or full OCT sector coverage; its attenuation model is conditional and must not be treated as a validated iris biomarker. Independent demonstrations of colorimetric repeatability, spatial correspondence, instrument-specific calibration and added information beyond conventional photography are required before clinical usefulness can be claimed.
References
[1] Edwards M, Gozdzik A, Ross K, Miles J, Parra EJ. Technical note: Quantitative measures of iris color using high resolution photographs. Am J Phys Anthropol. 2012;147:141–149. https://doi.org/10.1002/ajpa.21637
[2] Wollstein A, Walsh S, Liu F, Chakravarthy U, Rahu M, Seland JH, et al. Novel quantitative pigmentation phenotyping enhances genetic association, epistasis, and prediction of human eye colour. Sci Rep. 2017;7:43359. https://doi.org/10.1038/srep43359
[3] Mackey DA. What colour are your eyes? Teaching the genetics of eye colour & colour vision. Edridge Green Lecture RCOphth Annual Congress Glasgow May 2019. Eye. 2022;36:704–715. https://doi.org/10.1038/s41433-021-01749-x
[4] Gong P, Almasian M, van Soest G, de Bruin DM, van Leeuwen TG, Sampson DD, Faber DJ. Parametric imaging of attenuation by optical coherence tomography: review of models, methods, and clinical translation. J Biomed Opt. 2020;25(4):040901. https://doi.org/10.1117/1.JBO.25.4.040901
[5] Edwards M, Cha D, Krithika S, Johnson M, Cook G, Parra EJ. Iris pigmentation as a quantitative trait: variation in populations of European, East Asian and South Asian ancestry and association with candidate gene polymorphisms. Pigment Cell Melanoma Res. 2016;29:141–162. https://doi.org/10.1111/pcmr.12435
[6] Invernizzi A, Giardini P, Cigada M, Viola F, Staurenghi G. Three-dimensional morphometric analysis of the iris by swept-source anterior segment optical coherence tomography in a Caucasian population. Invest Ophthalmol Vis Sci. 2015;56:4796–4801. https://doi.org/10.1167/iovs.15-16483
[7] Li X, Hu L, Yang B, Xiao Z, Yamanari M, Higashita R, et al. Quantitative measurement of iris melanin concentration by polarization-sensitive anterior segment optical coherence tomography. Eur J Ophthalmol. 2026;36(4):872–880. https://doi.org/10.1177/11206721251407025
[8] Chang S, Bowden AK. Review of methods and applications of attenuation coefficient measurements with optical coherence tomography. J Biomed Opt. 2019;24:090901. https://doi.org/10.1117/1.JBO.24.9.090901
[9] Vermeer KA, Mo J, Weda JJA, Lemij HG, de Boer JF. Depth-resolved model-based reconstruction of attenuation coefficients in optical coherence tomography. Biomed Opt Express. 2014;5(1):322–337. https://doi.org/10.1364/BOE.5.000322
[10] Cannon TM, Bouma BE, Uribe-Patarroyo N. Layer-based, depth-resolved computation of attenuation coefficients and backscattering fractions in tissue using optical coherence tomography. Biomed Opt Express. 2021;12(8):5037–5056. https://doi.org/10.1364/BOE.427833
[11] Melgosa M, Rivas MJ, Gómez L, Hita E. Towards a colorimetric characterization of the human iris. Ophthalmic Physiol Opt. 2000;20(3):252–260. https://doi.org/10.1016/S0275-5408(99)00058-7
[12] Takamoto T, Schwartz B, Cantor LB, Hoop JS, Steffens T. Measurement of iris color using computerized image analysis. Curr Eye Res. 2001;22(6):412–419. https://doi.org/10.1076/ceyr.22.6.412.5490
[13] International Commission on Illumination. ISO/CIE 11664-4:2019. Colorimetry—Part 4: CIE 1976 L*a*b* colour space. Vienna: CIE; 2019.
[14] International Commission on Illumination. ISO/CIE 11664-6:2022. Colorimetry—Part 6: CIEDE2000 colour-difference formula. Vienna: CIE; 2022.
[15] Woo HL, Kim SS, Hudson SM. Correction of CIEDE2000 color difference formula for the analysis of low chroma and low lightness colors. Textile Coloration and Finishing. 2006;18(5):72–79.
[16] Lee RY, Lin SC, Chen RI, Barbosa DT, Lin SC. Association between light-to-dark changes in angle width and iris parameters in light, dark and changes from light-to-dark conditions. Br J Ophthalmol. 2016;100:1274–1279. https://doi.org/10.1136/bjophthalmol-2015-307393
[17] Safa BN, Bahrani Fard MR, Ethier CR. In vivo biomechanical assessment of iridial deformations and muscle contractions in human eyes. J R Soc Interface. 2022;19(192):20220108. https://doi.org/10.1098/rsif.2022.0108
[18] Yamanari M, Mase M, Obata R, Matsuzaki M, Minami T, Takagi S, et al. Melanin concentration and depolarization metrics measurement by polarization-sensitive optical coherence tomography. Sci Rep. 2020;10:19513. https://doi.org/10.1038/s41598-020-76397-4
[19] Bland JM, Altman DG. Statistical methods for assessing agreement between two methods of clinical measurement. Lancet. 1986;1(8476):307–310. https://doi.org/10.1016/S0140-6736(86)90837-8
[20] Koo TK, Li MY. A guideline of selecting and reporting intraclass correlation coefficients for reliability research. J Chiropr Med. 2016;15(2):155–163. https://doi.org/10.1016/j.jcm.2016.02.012
[21] Collins GS, Moons KGM, Dhiman P, et al. TRIPOD+AI statement: updated guidance for reporting clinical prediction models that use regression or machine learning methods. BMJ. 2024;385:e078378. https://doi.org/10.1136/bmj-2023-078378
Statements and Declarations
Funding
No external funding was received for this work.
Competing Interests
The author is the founder and developer of the Lumineyes™ method, proposes the L-OAT framework, and has a commercial interest in the clinical application of Lumineyes™.
Author Contributions
Mustafa Mete conceived and developed the L-OAT framework, directed the literature synthesis, critically revised the manuscript, and approved the final version.
Table 1. Proposed L-OAT candidate feature dictionary
Candidate baseline features for visible appearance (P), iris geometry (A) and OCT signal (O), followed by separate longitudinal outcomes. Features are proposals rather than validated measures; each requires documented acquisition, spatial coverage, repeatability and an explicit decision for missing or unusable signals.
| Domain | Candidate output | Source and units | Primary quality check |
| P | Global L*, a*, b*; dispersion | Calibrated photograph; CIELAB | Color target, glare/occlusion mask, repeat acquisition |
| P | 16-sector color profile | 2 radial × 8 angular photo regions | Sector coverage and pupil geometry |
| A | Iris thickness; curvature | Registered AS-OCT meridians; µm / geometry units | Landmarks, pupil state, intergrader agreement |
| A | Optional 3D geometry | Volumetric acquisition; device-specific units | Verified 3D scan and segmentation |
| O | Stromal signal/depth profile | Documented OCT intensity scale; a.u. | Export type, noise floor, focus and roll-off |
| O | Optional R or μ_app | Dimensionless ratio; attenuation in mm⁻¹ | Reference stability or estimator bias/precision |
| Follow-up | ΔL*, Δa*, Δb*; ΔE₀₀ | Registered paired photographs | Repeatability, time/exposure records |
| P/A/O | Cross-modal provenance and alignment | Image IDs, mapped coordinates, mask and registration errors | Pupil state, match confidence, no assumed OCT sector filling |
| QC | Quality and missingness record | Coverage, grader, device, software and analysis version | Document exclusion reasons, repeatability and subgroup drift |
Abbreviations: A, iris architecture; AS-OCT, anterior-segment optical coherence tomography; a.u., arbitrary units; CIELAB, Commission Internationale de l’Éclairage L*a*b* color space; O, optical coherence tomography signal; P, visible appearance; R, reference-normalized signal ratio; μ_app, apparent attenuation parameter; ΔE₀₀, CIEDE2000 color difference.
Table 2. Prespecified L-OAT validation gates, failure criteria and analysis decisions
Note. The entries are proposed criteria and decision rules; no empirical success or failure is claimed. A, architecture; O, OCT-signal domain; P, photographic appearance.
| Stage | Required evidence | Failure signal | Prespecified response |
| Feasibility | Calibrated images, export format, usable sector/depth coverage | Frequent ungradable images or unreliable calibration | Limit eligible feature set; report exclusions by phenotype |
| Repeatability | Paired reacquisitions, independent segmentation, agreement limits | Error too large for intended change or poor grader agreement | Reject or redefine unstable variables |
| Spatial matching | Pupil-adjusted photograph-to-OCT overlap and angular correspondence | Unreliable match or unknown OCT orientation | Use eye-level summaries; do not impute sector matching |
| Construct validity | Reproducible axes in held-out cohorts and available devices | Clusters collapse on replication or reflect acquisition conditions | Keep continuous descriptors; avoid claiming discrete types |
| Incremental value | Participant-disjoint comparison: P-only versus P+A+O | No credible out-of-sample improvement beyond measurement noise | Restrict L-OAT claim to descriptive phenotyping |
Table 3. Established measurement methods versus proposed L-OAT integration
Existing findings and proposed operational additions are separated; none of the proposed L-OAT advantages has been shown clinically.
| Approach | Published measurement capability | What L-OAT would standardize | Unresolved test / failure criterion |
| Calibrated photography | CIELAB, image-based color descriptors and heterogeneity [1, 2, 11, 12] | 16 photographic regions, provenance, low-lightness QC, area/missingness | Region stability and repeatability vs global CIELAB |
| AS-OCT morphometry | Meridional and volumetric iris geometry with proper acquisition [6, 16] | Recorded pupil state, scan meridian, landmarks, registration uncertainty | Reproducibility of match to photographic regions; abandon false sector matches |
| Standard intensity OCT | Depth-resolved signal, conditional attenuation descriptions [4, 8–10] | Export-type, background, roll-off, multiple-scattering sensitivity and exclusions | Phantom/reacquisition stability; omit nonidentifiable μ_app |
| PS-AS-OCT | Melanin-related polarimetric signal demonstrated in brown irides [7, 18] | Optional advanced O-subdomain, distinct from conventional OCT intensity | Transportability beyond studied devices and phenotypes |
| L-OAT integration | No patient-level integrated validation reported | P/A/O dictionary, auditable quality gates and prespecified held-out P-only comparison | No incremental gain or replicability → descriptive use only |